- « Previous Page
- 1
- …
- 162
- 163
- 164
- 165
- 166
- …
- 234
- Next Page »
Inventory
Weekly Market Report

For Week Ending February 10, 2018
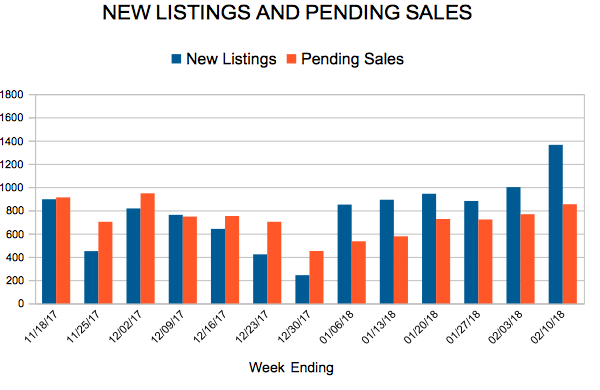
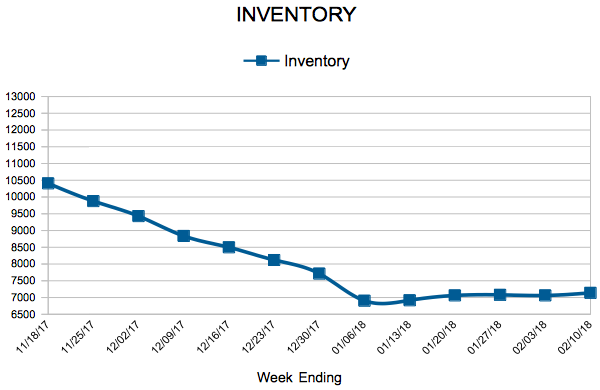
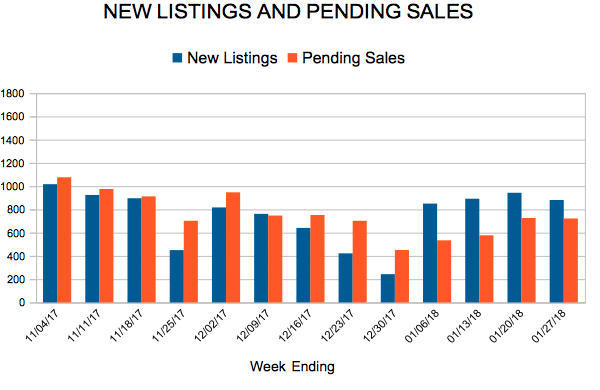
The market needs an increase in new listings in order to build inventory. It is something that has been needed for some time, and there has been positive movement in that regard in desirable submarkets. But it has not been consistent from week to week in year-over-year comparisons. Another way to boost inventory is to have fewer sales, but nobody wants to see that become an ongoing trend.
In the Twin Cities region, for the week ending February 10:
- New Listings increased 0.7% to 1,364
- Pending Sales decreased 6.9% to 853
- Inventory decreased 25.5% to 7,139
For the month of January:
- Median Sales Price increased 9.2% to $243,000
- Days on Market decreased 13.8% to 69
- Percent of Original List Price Received increased 1.0% to 96.9%
- Months Supply of Inventory decreased 22.2% to 1.4
All comparisons are to 2017
Click here for the full Weekly Market Activity Report. From The Skinny Blog.
Sluggish start to 2018 after a record 2017
The big story of 2017 was threefold: the median sales price reached an all-time high; closed sales reached a 12-year high; and inventory levels reached a 15-year low. Sales nearly broke their all-time record, but fell just 12 units short of their all-time 2004 high. In January 2018, new listings posted a year-over-year decline for a third consecutive month. Because of the supply shortage, closed sales were lower compared to the year prior for a second consecutive month. For-sale housing supply (inventory) was about a quarter lower than January 2017. This shortage has created a competitive environment where multiple offers have become commonplace. Sellers are receiving strong offers close to their original list price in record time, which can sometimes frustrate home buyers. New construction pending sales rose nearly 14.0 percent compared to last January. Although single-family homes made up about 76.0 percent of all sales, townhomes were the only segment to show an increase in pending sales. Similarly, previously-owned homes made up about 91.0 percent of sales but new construction showed a much stronger increase in pending purchase activity.
January 2018 by the Numbers
• Sellers listed 4,041 properties on the market, a 7.8 percent decrease from January 2017
• Buyers closed on 2,758 homes, a 4.4 percent decrease from 2017
• Inventory levels for January fell 26.3 percent compared to 2017 to 6,875 units, near a 15-year low
• Months Supply of Inventory was down 27.8 percent to 1.3 months, a 15-year low
• The Median Sales Price rose 9.6 percent to $243,750, a record high for January
• Cumulative Days on Market declined 13.8 percent to 69 days, on average (median of 45)—a 12-year low
• Changes in sales activity varied by market segment
-
o Single-family sales fell 1.3 percent; condo sales fell 15.1 percent; townhome sales fell 8.5 percent
o Traditional sales fell 1.7 percent; foreclosure sales fell 21.8 percent; short sales fell 42.4 percent
o Previously-owned sales fell 3.8 percent; new construction sales fell 0.4 percent
Mortgage Rates Continue to Climb
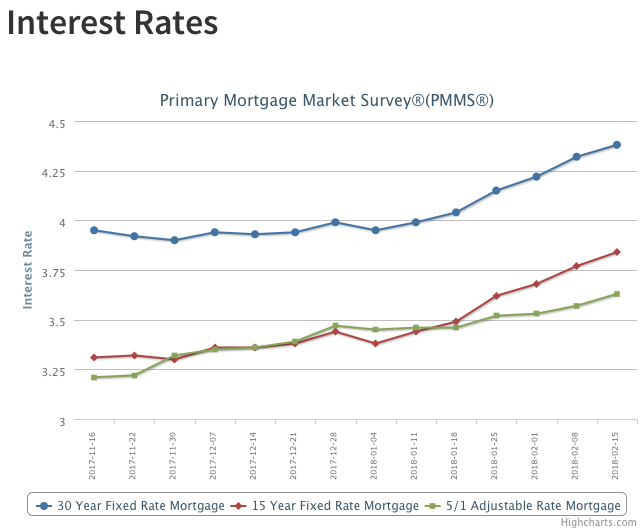
Wednesday’s Consumer Price Index report showed higher-than-expected inflation; headline consumer price inflation was 2.1 percent year-over-year in January two tenths of a percentage point higher than the consensus forecast. Inflation measures were broad-based, cementing expectations that the Federal Reserve will go forward with monetary tightening later this year. Following this news, the 10-year Treasury reached its highest level since January 2014, climbing above 2.90 percent. Mortgage rates have also surged. After jumping 10 basis points last week, the 30-year fixed-rate mortgage rose 6 basis points to 4.38 percent, its highest level since April 2014.
New Listings and Pending Sales
Inventory
Weekly Market Report

For Week Ending February 3, 2018
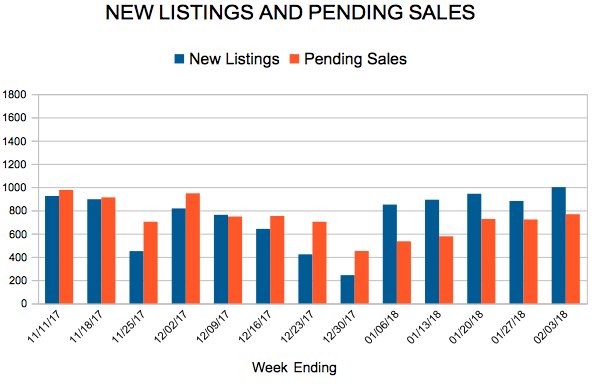
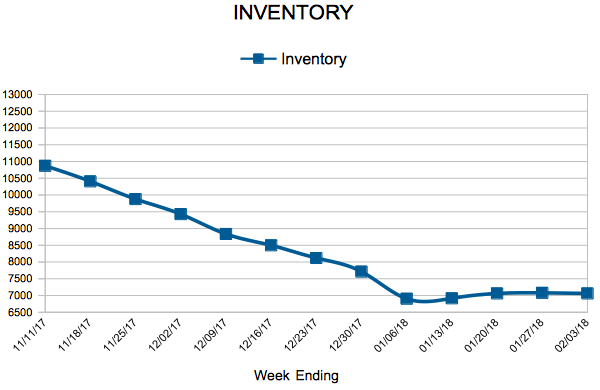
As we get beyond the newness of the year and into the idea that 2018 is here and now, there is plenty of excitement about the promise presented within strong economic conditions and an active real estate market. Buyers are taking fresh listings that show well off the market in short order, and it is evident that the lack of inventory is driving prices up and market time down.
In the Twin Cities region, for the week ending February 3:
- New Listings decreased 24.2% to 1,000
- Pending Sales decreased 19.3% to 767
- Inventory decreased 25.0% to 7,062
For the month of December:
- Median Sales Price increased 9.7% to $248,000
- Days on Market decreased 15.3% to 61
- Percent of Original List Price Received increased 1.3% to 97.1%
- Months Supply of Inventory decreased 26.3% to 1.4
All comparisons are to 2017
Click here for the full Weekly Market Activity Report. From The Skinny Blog.
Mortgage Rates Jump Again
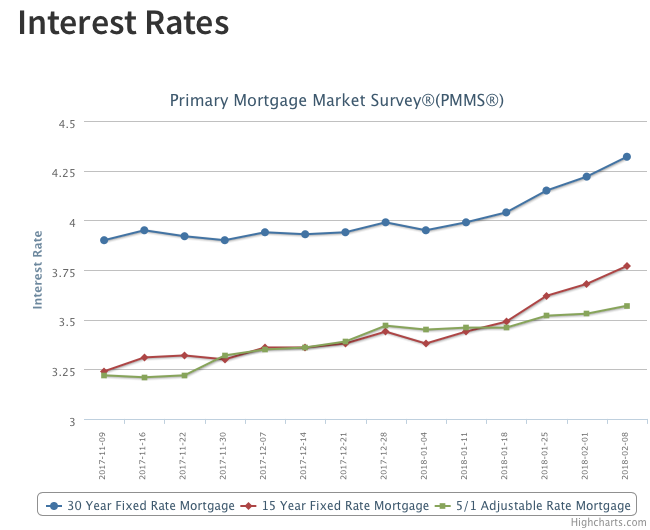
The U.S. weekly average 30-year fixed mortgage rate rocketed up 10 basis points to 4.32 percent this week. Following a turbulent Monday, financial markets settled down with the 10-year Treasury yield resuming its upward march. Mortgage rates have followed. The 30-year fixed mortgage rate is up 33 basis points since the start of the year. Will higher rates break housing market momentum? It’s too early to tell for sure, but initial readings indicate housing markets are sustaining their momentum so far. The MBA reported that purchase applications are up 8 percent from a year ago in their latest Weekly Mortgage Applications Survey.
New Listings and Pending Sales
- « Previous Page
- 1
- …
- 162
- 163
- 164
- 165
- 166
- …
- 234
- Next Page »
