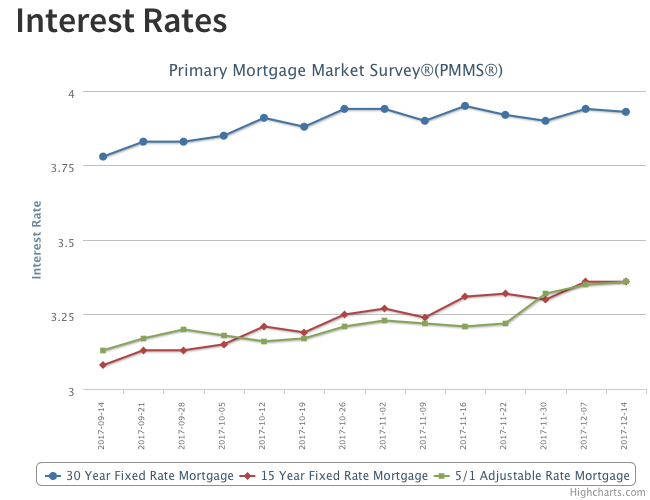
30-year fixed mortgage rates have been bouncing around in a narrow 10 basis points range since October. The U.S. average 30-year fixed mortgage rate increased 1 basis point to 3.94 percent in this week’s survey. The majority of Freddie Mac’s Primary Mortgage Market Survey® (PMMS®) was completed prior to the surge in long-term interest rates that followed the passage of the tax bill. If those rate increases stick, we’ll likely see higher mortgage rates in next week’s survey. But even with yesterday’s increase, the 10-year Treasury yield is down from a year ago, and 30-year fixed mortgage rates are 36 basis points below the level we saw in our survey last year at this time. Mortgage rates are low.
- « Previous Page
- 1
- …
- 166
- 167
- 168
- 169
- 170
- …
- 234
- Next Page »
Existing Home Sales
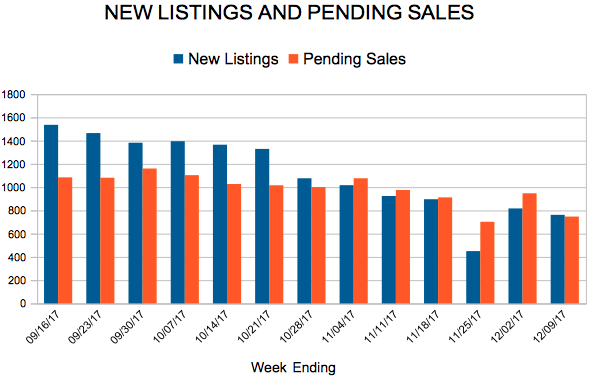
New Listings and Pending Sales
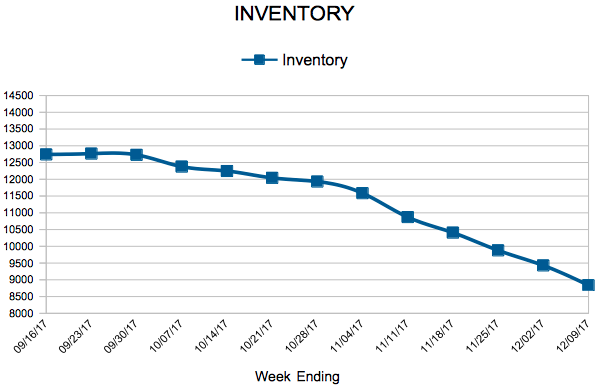
Inventory
Weekly Market Report
For Week Ending December 9, 2017
National economic trends can help inform what the housing market will do over the next year. Residential real estate should remain active if joblessness continues to decline and wage growth picks up. However, those increased wages must be in line with median sales price increases. Unfortunately, that has not always been the case. Add in factors such as increasing mortgage rates, student loan debt and lower affordability, and the balance becomes more interesting but not insurmountable for home purchasers.
In the Twin Cities region, for the week ending December 9:
- New Listings increased 3.0% to 762
- Pending Sales decreased 7.5% to 747
- Inventory decreased 23.5% to 8,837
For the month of November:
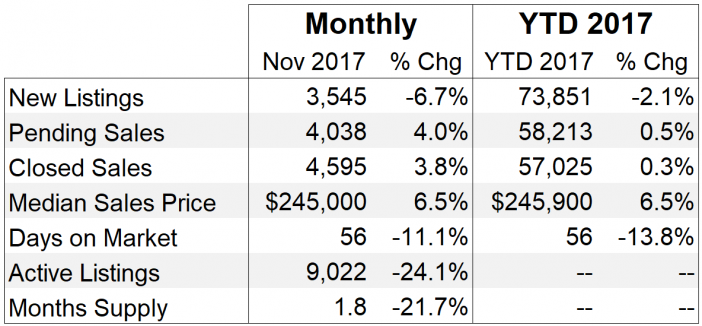
- Median Sales Price increased 6.5% to $245,000
- Days on Market decreased 11.1% to 56
- Percent of Original List Price Received increased 0.8% to 97.4%
- Months Supply of Inventory decreased 21.7% to 1.8
All comparisons are to 2016
Click here for the full Weekly Market Activity Report. From The Skinny Blog.
Home prices reach new record while sales growth moderates
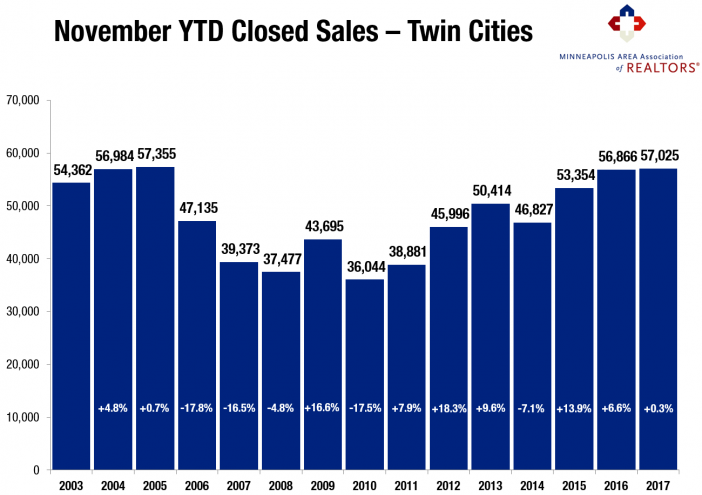
With the majority of 2017 in the books, the Twin Cities housing market is likely to cap off another mostly positive year. Sales and prices both increased while interest rates remained attractive. More homes sold in less time and for closer to asking price. The economy remained supportive to housing by way of low unemployment and moderate job and wage growth. The biggest challenge facing the market hasn’t changed over the last several years; a persistent lack of inventory continues to frustrate buyers.
The table highlights November monthly activity as well as 2017 YTD activity with year-over-year change. New listings are down 2.1 percent for the year so far and closed sales are up 0.3 percent. Prices are likely to end the year around $245,500, up about 6.5 percent compared to 2016. At a brisk 56 days, market times are down 13.8 percent for the year, indicating sellers are accepting offers more quickly. And lastly, the number of active listings on the market is down 24.1 percent to just over 9,000 homes for sale. With months supply at just 1.8 months, absorption rates are at their lowest level in at least 15 years and indicates a sellers’ market.
Generally, five to six months of supply is considered a balanced market where neither buyers nor sellers have an edge. Given near-record demand and suppressed supply, prices scurried higher. The end of 2017 will mark the sixth consecutive year of rising home prices. Home prices are above their prior peak from 2006, as are median household incomes in the metro area.
“Sellers are generally enjoying and also encouraged by rising prices,” said Cotty Lowry, Minneapolis Area Association of REALTORS® (MAAR) President. “It speaks to the health of our region and confirms that recovery continues. But the shortage has forced many to delay listing, since most sellers are also buyers. And some buyers—mostly in the affordable price ranges—are finding it challenging to lock down the next place to call home.”
The economy and political environment also affect housing. The national unemployment rate is 4.1 percent, though it’s 2.3 percent locally—the lowest unemployment rate of any major metro area. A diverse economy supports housing, as job and wage growth are key to new household formations. The Minneapolis–St. Paul region has a resilient economy with a global reach, a talented workforce, top-notch schools, exposure to the growing technology and healthcare fields and a quality of life that’s enabled one of the highest homeownership rates in the country.
The average 30-year fixed mortgage rate declined from 4.3 percent to 3.9 percent recently, still well below its long-term average of around 8.0 percent. A third rate hike was announced this month. Additional inventory is still needed in order to offset declining affordability brought on by higher prices and interest rates.
“The year is poised to end on a mostly positive note,” said Kath Hammerseng, MAAR President-Elect. “Aside from inventory constraints and a thorny tax bill, construction activity, seller confidence and interest rates will be key indicators to watch in 2018.”
From The Skinny Blog.
Mortgage Rates Little Changed
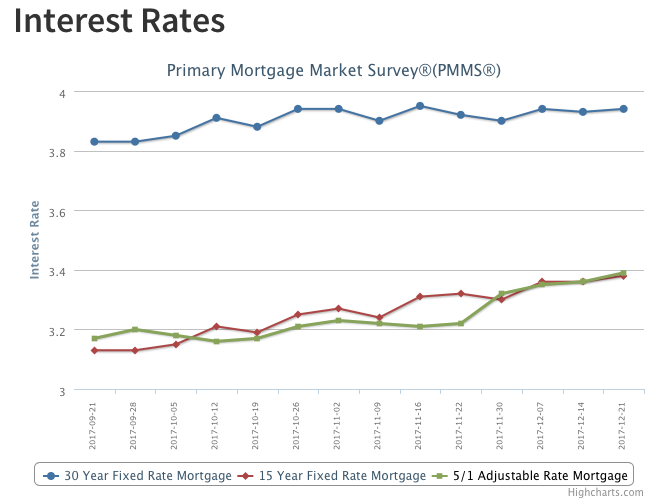
As widely expected, the Fed increased the federal funds target rate this week for the third time in 2017. The market had already priced in the rate hike so long-term interest rates, including mortgage rates, hardly moved. Mortgage rates have been in a holding pattern for the fourth quarter, remaining within a 10 basis point range since October.
New Listings and Pending Sales
Inventory
Weekly Market Report
For Week Ending December 2, 2017
As the year works its way to a closing crescendo, it is evident that the year’s predominant storyline is beyond a clever weekly jab. It has been an interesting and remarkably positive year for residential real estate. Even as some desirable housing tax breaks are on the verge of sunsetting, real estate, as a whole, remains in great shape.
In the Twin Cities region, for the week ending December 2:
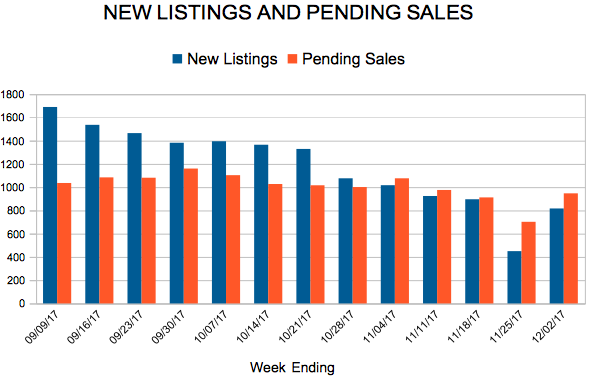
- New Listings increased 6.7% to 817
- Pending Sales decreased 1.3% to 947
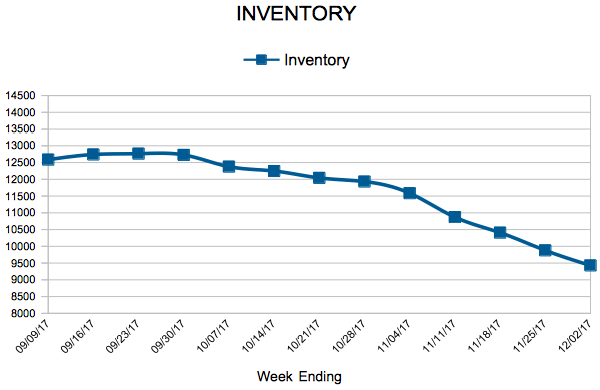
- Inventory decreased 22.7% to 9,429
For the month of October:
- Median Sales Price increased 6.1% to $244,000
- Days on Market decreased 14.8% to 52
- Percent of Original List Price Received increased 0.8% to 97.7%
- Months Supply of Inventory decreased 14.8% to 2.3
All comparisons are to 2016
Click here for the full Weekly Market Activity Report. From The Skinny Blog.
- « Previous Page
- 1
- …
- 166
- 167
- 168
- 169
- 170
- …
- 234
- Next Page »